Multivariate Linear Regression Analysis
Predict lending interest rate using multivariate linear regression analysis
Data example
Purpose
Interest Rate
Installment
Annual income
DTI
FICO
credit_card
0.1071
228.22
11.08214255
14.29
707
debt_consolidation
0.1357
366.86
10.37349118
11.63
682
debt_consolidation
0.1008
162.34
11.35040654
8.1
712
credit_card
0.1426
102.92
11.29973224
14.97
667
credit_card
0.0788
125.13
11.90496755
16.98
727
debt_consolidation
0.1496
194.02
10.71441777
4
667
all_other
0.1114
131.22
11.00209984
11.08
722
home_improvement
0.1134
87.19
11.40756495
17.25
682
debt_consolidation
0.1221
84.12
10.20359214
10
707
debt_consolidation
0.1347
360.43
10.4341158
22.09
677
debt_consolidation
0.1324
253.58
11.83500896
9.16
662
debt_consolidation
0.0859
316.11
10.93310697
15.49
767
small_business
0.0714
92.82
11.51292546
6.5
747
debt_consolidation
0.0863
209.54
9.487972109
9.73
727
major_purchase
0.1103
327.53
10.73891524
13.04
702
all_other
0.1317
77.69
10.52277288
2.26
672
credit_card
0.0894
476.58
11.60823564
7.07
797
debt_consolidation
0.1039
584.12
10.49127422
3.8
712
major_purchase
0.1513
173.65
11.00209984
2.74
667
all_other
0.08
188.02
11.22524339
16.08
772
Loading...
CSV file with full data can be accessed here:
https://nick.fit//blog/linear-regression-analysis/loan_data.csv
Let's say you have a task where you have to predict lending interest rate charged to the borrower having the data above. First, import data:
import pandas as pd
import numpy as np
import statsmodels.api as sm
loansData = pd.read_csv('loan_data.csv')
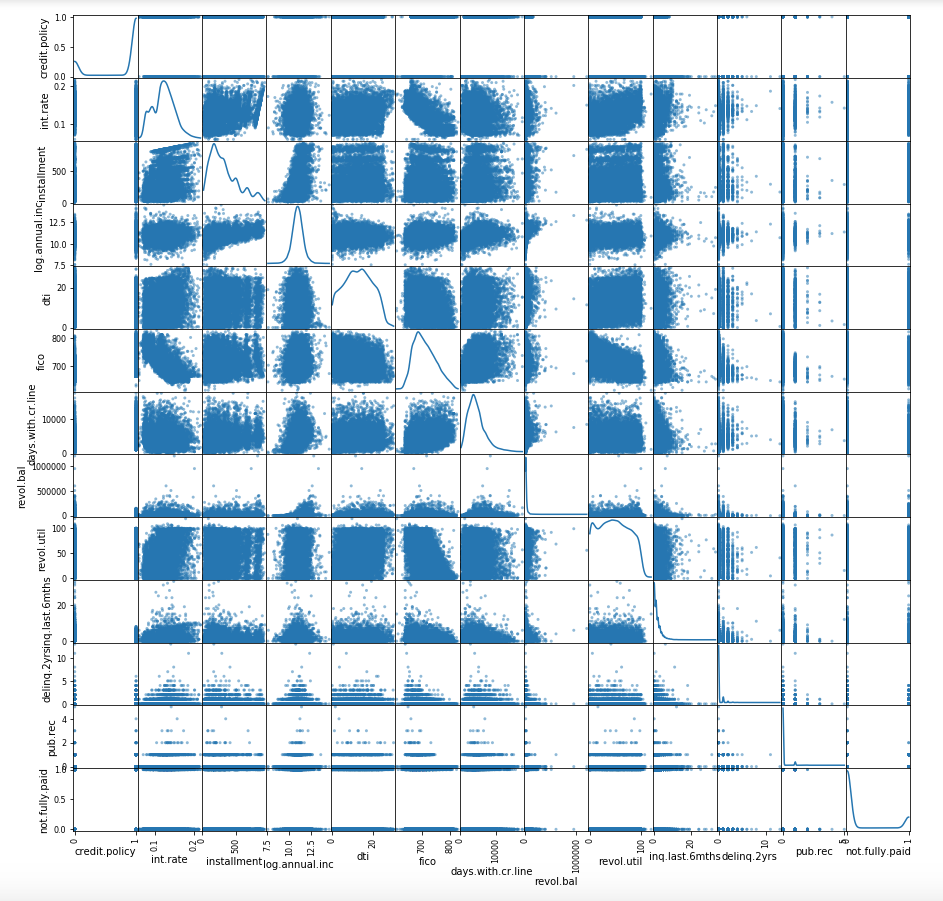
In order to be able to understand which fields from the CSV file affects seeking interest rate we have to build Scatterplot Matrix first. For reference https://en.wikipedia.org/wiki/Scatter_plot
pd.plotting.scatter_matrix(loansData,figsize=(15,15),diagonal='kde')If you pay attention "int.rate" does not depend on ["credit.policy", "revol.bal", "inq.last.6mths", "delinq.2yrs", "pub.rec", "not.fully.paid"]. It doesn't depend because for each different "int.rate" value corresponds almost the same value from mentioned columns. Thus we can skip these columns.
For the rest columns we are going to create linear model using OLS from statsmodels
interestRate = loansData['int.rate']
installment = loansData['installment']
logAnnualInc = loansData['log.annual.inc']
dti = loansData['dti']
fico = loansData['fico']
daysWithCrLine = loansData['days.with.cr.line']
revolUtil = loansData['revol.util']

y = np.matrix(interestRate).transpose()
x1 = np.matrix(installment).transpose()
x2 = np.matrix(logAnnualInc).transpose()
x3 = np.matrix(dti).transpose()
x4 = np.matrix(fico).transpose()
x5 = np.matrix(daysWithCrLine).transpose()
x6 = np.matrix(revolUtil).transpose()

x = np.column_stack([x1,x2,x3,x4,x5,x6])
# create a linear model
X = sm.add_constant(x)
model = sm.OLS(y,X)
f = model.fit()

print ("pvalues = %s, rsquared = %s" % (f.pvalues, f.rsquared))
print ("Intercept = %s, Coefficients = %s" % (f.params[2], f.params[0:2]))
P-Values are probabilities. The convention is it needs to be 0.05 or less:
https://en.wikipedia.org/wiki/P-value
R-squared is a measure of how much of the variance in the data is captured by the model. A high R-squared would be close to 1.0 a low one would be close to 0. The value we've got = 0.63, is a good one.
https://en.wikipedia.org/wiki/Coefficient_of_determination
Trying to decrease number of depended variables (currently we've got 6) and keeping eye on P-Values and R-squared we end up with x1 and x4 will produce almost the same values be had before.
x = np.column_stack([x1,x4])Formula
InterestRate=a0+a1⋅Installment+a2⋅Fico
where a0 is the Interceptor and a1, a2 are Coefficients for Installment and Fico respectively. Thank you for reading to the end :)
Technologies
- Python
- statsmodels
- Scatterplot Matrix
Positive attitude detecting
Simple Captcha Reader
